Usecase

From referenceTSS
Jump to: navigation, search

refTSS4.1_use-case

Use-case of refTSS version 4


With the update to version 4 in refTSS, various revisions have been added, including information on candidate of cis-regulatory element (cCRE), FANTOM promoter expression table, and GWAS-LD enrichment analysis. Here, we briefly introduce use-case of the refTSS4 for the biomedical researches.


1. Surveillance of potential candidates for the promoter and proximal cis-elemment of the gene of interest.

In refTSS, it is possible to search using TSS ID, gene symbol, and gene ID from the TSS database. This result includes not only standard annotations such as gene, transcript and protein information, but also supports cCREs information for the first time in version 4. For example, promoter candidates supported by DNase hypersensitve site and histone modification have the PLS in the cCRE category, and when investigating regulatory regions, they have the cCRE categories. This provides the basis for deciding which TSS to select for study among multiple TSSs found in one gene locus.

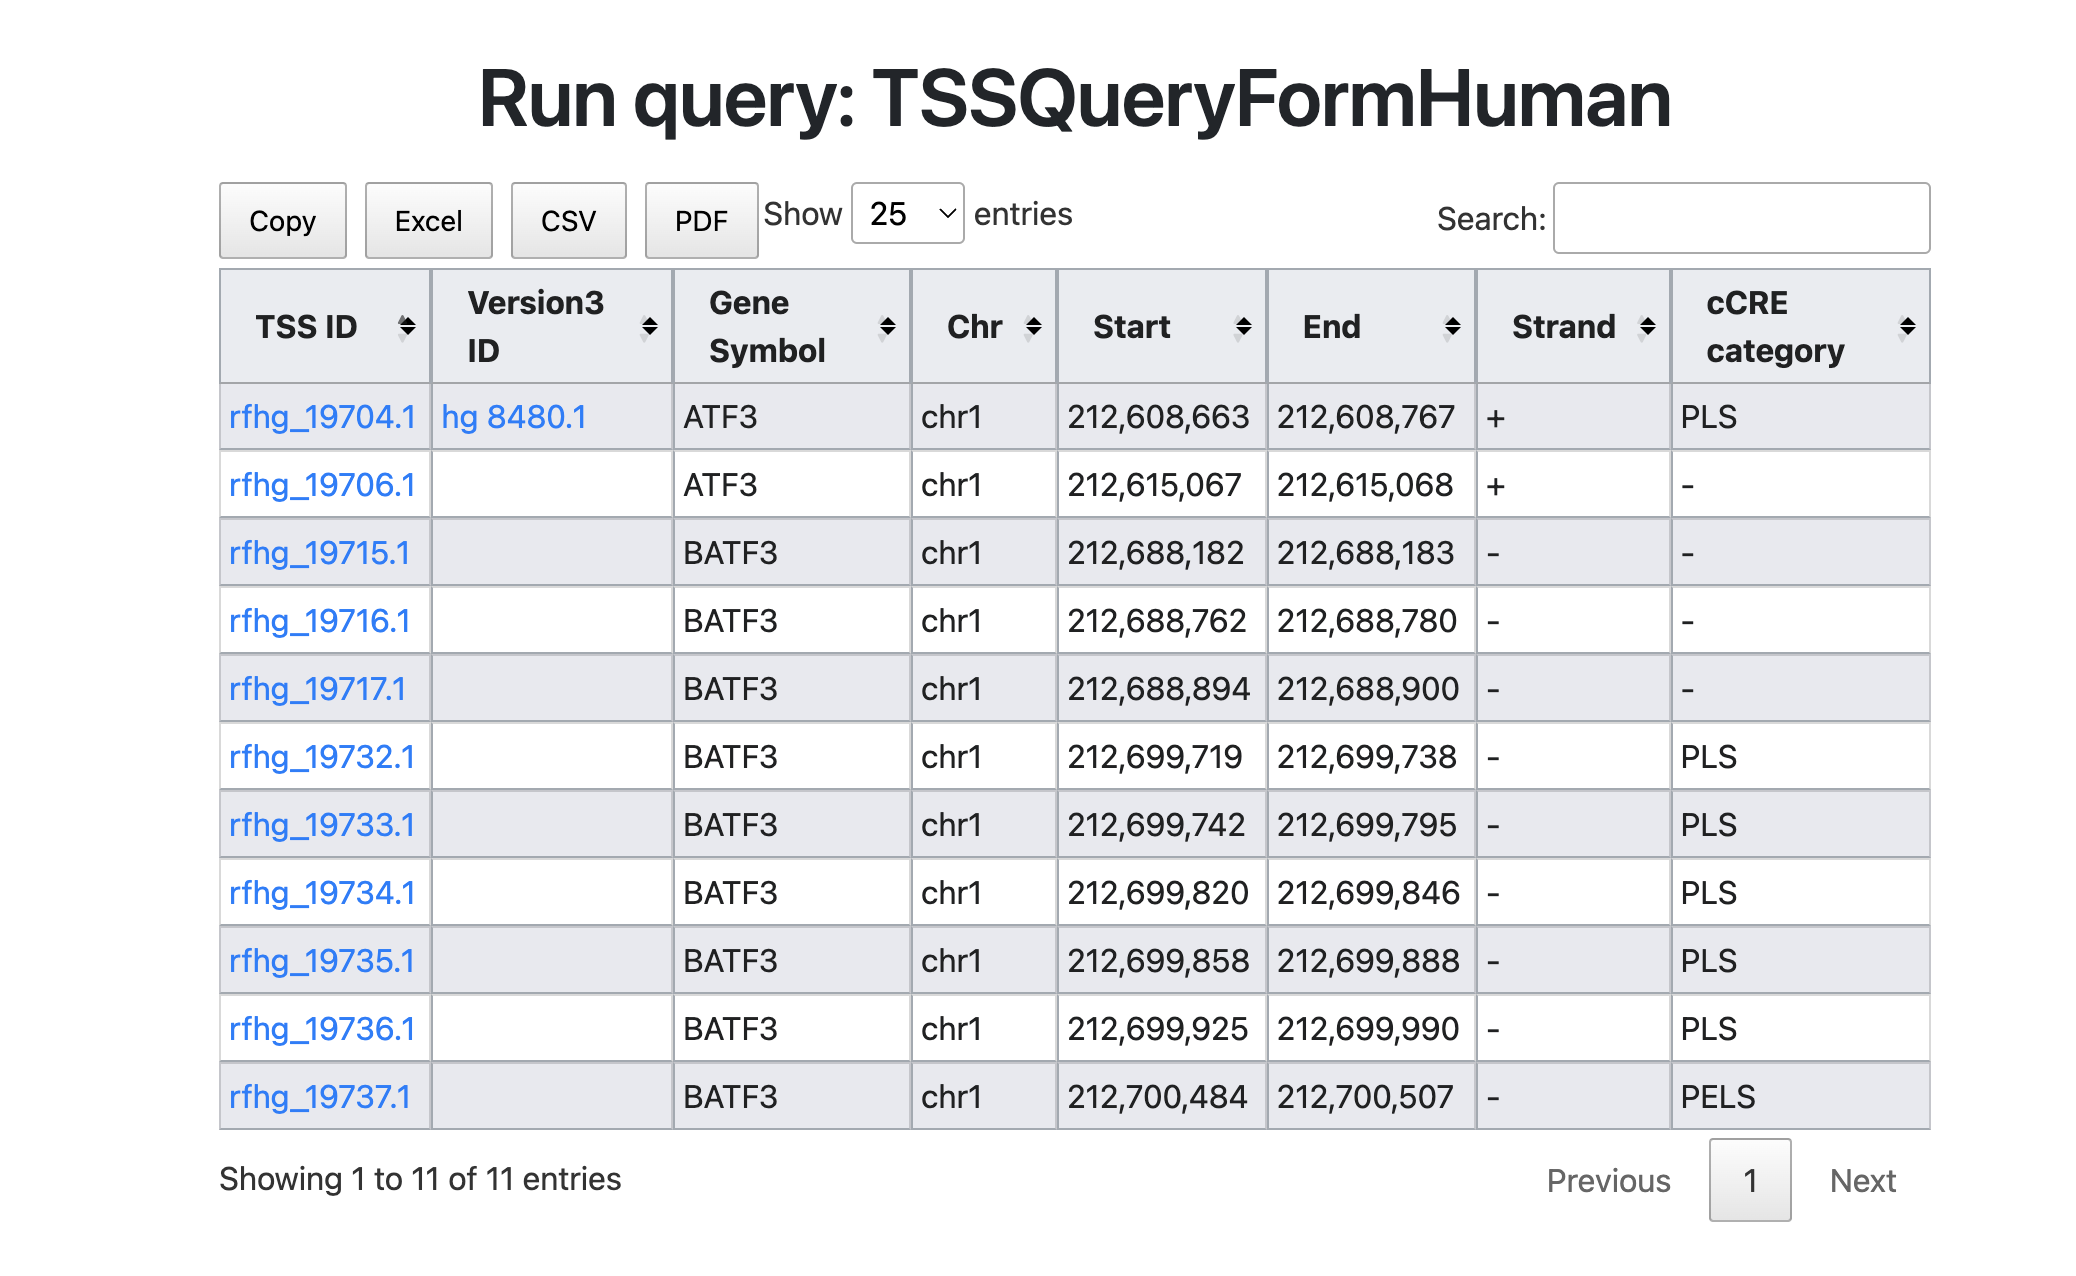
Here we start to search the "ATF3" gene in TSS database. ATF3 is a transcription factor of the CREB/ATF family, involved in various cellular processes including inflammatory responses and the cell cycle. I plan to investigate the promoters and cis-elements that regulate this transcription factor by conducting a search.
スクリーンショット 2023-06-07 17.45.37

The figure above shows the search results for the keyword "ATF3." This results include not only ATF3 but also BATF3 (Basic leucine zipper transcription factor, ATF-like 3). Although BATF3 is located in a chromosomal region close to ATF3, it is a distinct gene. Therefore, two TSSs have been annotated for the ATF3 gene. BATF3 shows several TSSs overlapping with PLS and pELS. Users can survey cis-element information using refTSS-cCRE connections.


2. Investigating differences in expression levels between splicing variants using FANTOM5 TSS expression table
スクリーンショット 2023-06-07 18.56.08

スクリーンショット 2023-06-07 18.59.38

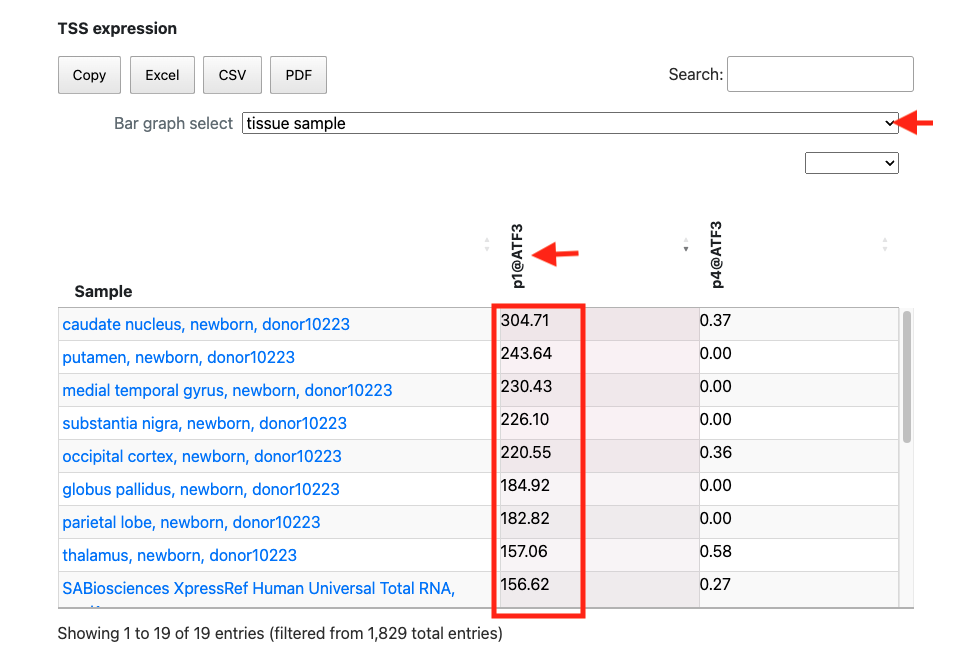
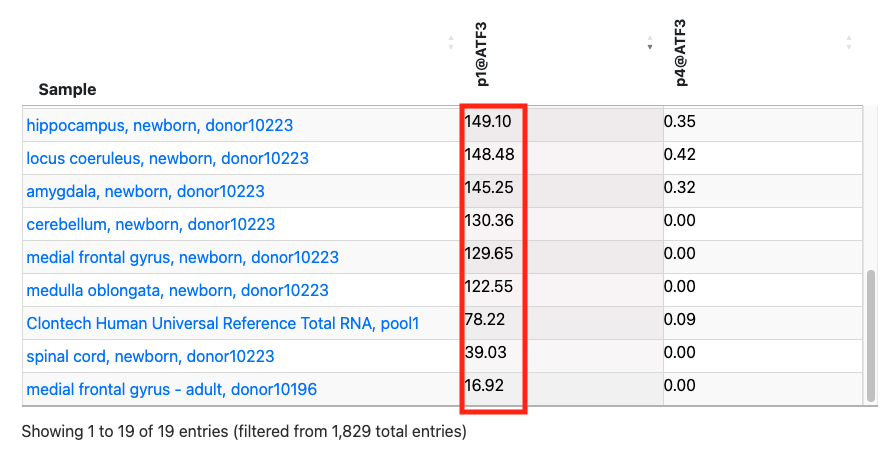
In the above figure, rfhg_19704.1 is displayed and its annotations are checked. The expression table is pickuped from at the bottom of page. Then, the FANTOM5 promoter ID "p1@ATF3" is clicked on to sort it by expression level. Additionally, by selecting the tissue sample in the Bar graph select, tissue-derived samples are extracted. While the promoter p4@ATF3 exhibits low expression in 19 tissue samples, p1@ATF3 is expressed in all tissue samples. This suggests that the main ATF3 promoter is p1@ATF3, which overlaps with TSS rfhg_19704.1.


3. Workflow of GWAS-LD enrichment analysis

GWAS-LD enrichment analysis examines the number of TSSs overlapping with LD blocks on the genome or a given TSS ID list provided by the user (e.g. significant TSS sets from differential analysis). Here we introduce the worklow of this method.

スクリーンショット 2023-06-05 23.36.36

  1. Differential analysis is carried out with refTSS as the reference.

    1. TSS tag counts are calculated against the refTSSv4 TSS reference using TSS sequencing data (e.g., CAGE, RAMPAGE and etc.). For instance, featureCounts function in Subread package can be useful for this process.
    2. Normalization and statistical testing process was performed by standard packages such as DESeq2 and edgeR. For example we use edgeR for calculating statistical significance between treat and control samples.
    3. The IDs of TSSs showing significant expression changes are then extracted from the testing results. The extracted TSS IDs are input into the refTSS website window for GWAS-LD enrichment analysis. Here, we provide an example file of TSS ID list, which were obtained from CAGE analysis of neural crest cell differentiation of iPS cell experiments (day0_vs_day18).


  2. GWAS-LD enrichment analysis

    1. From the menu, select the refTSS-LD and paste the TSS IDs into the box.
  1. Interpreting the results of the enrichment analysis

    1. The table shows the results of the GWAS-LD analysis conducted using the example data. Results are sorted by order of FDR. The enriched TSS IDs are displayed in the "hits" column, allowing for inspection of which TSSs are concentrated in LD blocks grouped by traits.

4. Workflow of general annotation enrichment analysis

GO and KEGG pathways annotation enrichment analysis examines over-representation of the number of genes with biological annotations such as GO and KEGG pathways. Here we introduce the workflow of general annotation enrichment analysis using refTSS and external enrichment analysis tools.

  1. General annotation enrichment analysis is carried out with refTSS as the reference.

    1. TSS tag counts are calculated against the refTSSv4 TSS reference using TSS sequencing data (e.g., CAGE, RAMPAGE and etc.). For instance, featureCounts function in Subread package can be useful for this process.
    2. Normalization and statistical testing process was performed by standard packages such as DESeq2 and edgeR. For example we use edgeR for calculating statistical significance between treat and control samples.
    3. TSS tag counts are calculated against the refTSSv4 TSS reference using TSS sequencing data (e.g., CAGE, RAMPAGE and etc.). For instance, featureCounts function in Subread package can be useful for this process.
    4. The IDs of TSSs showing significant expression changes are then extracted from the differential expression analysis result.
    5. Then, the TSS IDs were inputed in ID conversion tool in refTSS website.
    6. The extracted Gene Symbols are input into the external enrichment analysis tools such as DAVID, MetaScape and ClusterProfiler.