Usecase ea: Difference between revisions
From referenceTSS
No edit summary |
No edit summary |
||
| (23 intermediate revisions by the same user not shown) | |||
| Line 1: | Line 1: | ||
{{DISPLAYTITLE:Enrichment Analyses}} | |||
---- | |||
One of the standard approaches in downstream analysis of gene expression is enrichment analysis that can be useful for evaluating biological function under condition. In this use-case, two scenarios of annotation enrichment analyses are introduced for refTSS users. | |||
* ''' Gene enrichment analyses''' | |||
: '''GO and KEGG pathway annotation enrichment analysis''' are commonly used for examination of the over-representation of gene annotations. Here we introduce the workflow of general annotation enrichment analysis using refTSSs. | |||
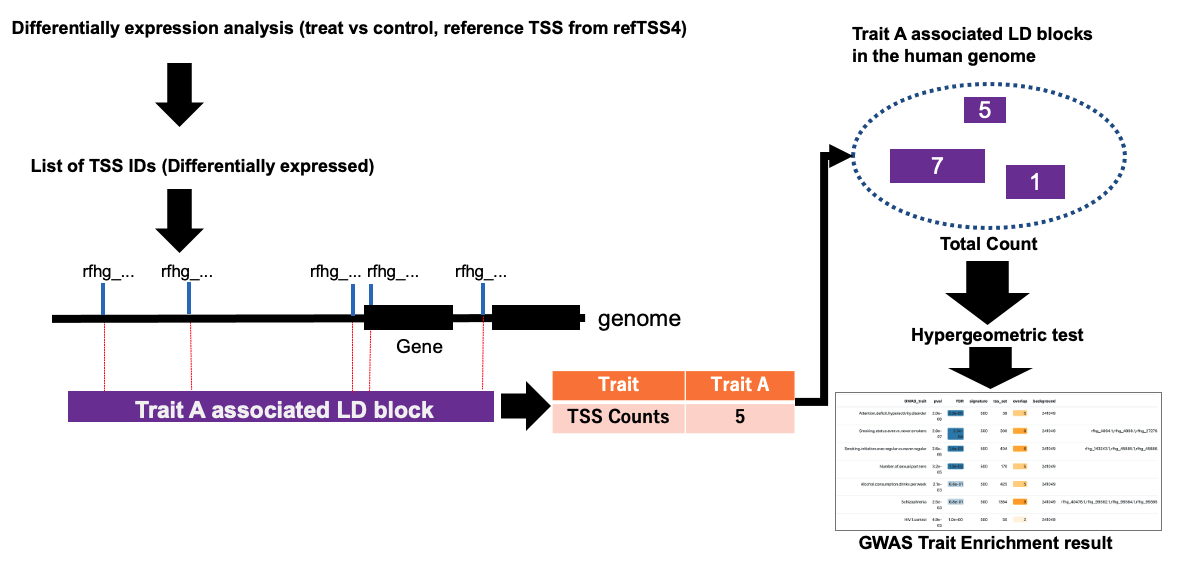
* ''' GWAS-LD enrichment analysis''' | |||
: Novel enrichment service called '''refTSS-LD''' was lunched on refTSS4. refTSS-LD provides '''GWAS-LD enrichment analysis''' using refTSS IDs. | |||
For checking both approaches, there is an example input file of TSS ID lists from CAGE analysis of neural crest cell differentiation experiments with iPS cells ([[Source::https://reftss.riken.jp/reftss/userfiles/gwas_ld_example_ids.230607.txt| day0_vs_day18]]). | |||
---- | |||
<html> | <html> | ||
<p style="text-align: center;"><img src="https:// | <p style="text-align: center;"><img src="https://raw.githubusercontent.com/suimye/test_github/main/uPic/%E3%82%B9%E3%82%AF%E3%83%AA%E3%83%BC%E3%83%B3%E3%82%B7%E3%83%A7%E3%83%83%E3%83%88%202023-06-05%2023.36.36.png" style="zoom:60%;"></p> | ||
</html> | </html> | ||
---- | ---- | ||
==== 1. Gene annotation enrichment analysis ==== | |||
==== | : Annotation enrichment analysis examines the over-representation of genes of interest with biological annotations such as GO and KEGG pathways. To apply TSS analysis using refTSS to gene annotation enrichment, '''TSS IDs must be converted to gene IDs or symbols ''' for input into annotation enrichment tools. refTSS4 has newly launched a simple web tool for converting TSS IDs to gene symbols to support refTSS users. | ||
<html> | <html> | ||
| Line 42: | Line 27: | ||
</html> | </html> | ||
===== | 1.1. '''TSS expression analysis and extraction of statistically significant TSSIDs.''' | ||
: TSS sequencing is useful method for evaluation of gene expression value using TSS tags. refTSS4 introduces how to perform differential analysis of TSS on [[Usecase2|Tutorial of TSS differential analysis ]]. | |||
<div></div> | |||
1.2. '''ID conversion from TSSID to Official Gene symbols.''' | |||
: Conversion of differentially expressed TSSID to [[IdConversion|ID conversion tools ]] | |||
: <html> | |||
<p style="text-align: center;"><img src="https://github.com/suimye/test_github/assets/296176/7d0d22ab-4622-4d9f-819d-0c0df08e42db" style="zoom:60%;"></p> | |||
</html> | |||
1.3. '''External enrichment tools (e.g., DAVID, Metascape, TopGO).''' | |||
: The extracted Gene Symbols are input into external enrichment analysis tools such as '''DAVID, MetaScape'''. | |||
<li> [https://david.ncifcrf.gov DAVID] </li> | |||
<li> [https://metascape.org/gp/index.html#/main/step1 Metascape] </li> | |||
<li> [https://bioconductor.org/packages/release/bioc/html/topGO.html TopGO (R package)] </li> | |||
<li> [https://bioconductor.org/packages/release/bioc/html/clusterProfiler.html ClusterProfiler (R package)] </li> | |||
<br><br> | |||
1.4. '''Reference''' | |||
<li>[https://doi.org/10.1093/nar/gkac194 B.T. Sherman, M. Hao, J. Qiu, X. Jiao, M.W. Baseler, H.C. Lane, T. Imamichi and W. Chang. DAVID: a web server for functional enrichment analysis and functional annotation of gene lists (2021 update). Nucleic Acids Research. 23 March 2022.]</li> | |||
<li>[https://doi.org/10.1038/s41467-019-09234-6 Zhou et al. Nature Commun. 2019 10(1):1523.]</li> | |||
<li>[https://bioconductor.org/packages/release/bioc/html/topGO.html Alexa A, Rahnenfuhrer J (2024). topGO: Enrichment Analysis for Gene Ontology. R package version 2.58.0.]</li> | |||
<li>[https://doi.org/10.1038/s41596-024-01020-z Xu S, Hu E, Cai Y, Xie Z, Luo X, Zhan L, Tang W, Wang Q, Liu B, Wang R, Xie W, Wu T, Xie L, Yu G (2024). “Using clusterProfiler to characterize multiomics data.” Nature Protocols. ISSN 1750-2799]</li> | |||
<br><br> | |||
---- | |||
==== 2. GWAS-LD enrichment analysis on refTSS-LD ==== | |||
: As well as the other enrichment tools, refTSS provides simple enrichment analysis service, [[GWAS-LD_enrichment|refTSS-LD]]. This service provides GWAS-LD enrichment analysis. | |||
: <html> | |||
<p style="text-align: center;"><img src="https://github.com/suimye/test_github/assets/296176/15be287f-be9a-437e-b0b0-10cedceaf619" style="zoom:60%;"></p> | |||
</html> | |||
: From the menu, select refTSS-LD and paste the TSS IDs into the box. | |||
: <html> | |||
<p style="text-align: center;"><img src="https://github.com/suimye/test_github/assets/296176/1cf69b4d-d103-4ea5-a824-443c602fb4b0" style="zoom:60%;"></p> | |||
</html> | |||
: The table shows the results of the GWAS-LD analysis conducted using the example data. Results are sorted by order of FDR. The enriched TSS IDs are displayed in the "hits" column, allowing for inspection of which TSSs are concentrated in LD blocks grouped by traits. | |||
---- | |||
Latest revision as of 17:06, 15 November 2024
One of the standard approaches in downstream analysis of gene expression is enrichment analysis that can be useful for evaluating biological function under condition. In this use-case, two scenarios of annotation enrichment analyses are introduced for refTSS users.
- Gene enrichment analyses
- GO and KEGG pathway annotation enrichment analysis are commonly used for examination of the over-representation of gene annotations. Here we introduce the workflow of general annotation enrichment analysis using refTSSs.
- GWAS-LD enrichment analysis
- Novel enrichment service called refTSS-LD was lunched on refTSS4. refTSS-LD provides GWAS-LD enrichment analysis using refTSS IDs.
For checking both approaches, there is an example input file of TSS ID lists from CAGE analysis of neural crest cell differentiation experiments with iPS cells (day0_vs_day18).
1. Gene annotation enrichment analysis
- Annotation enrichment analysis examines the over-representation of genes of interest with biological annotations such as GO and KEGG pathways. To apply TSS analysis using refTSS to gene annotation enrichment, TSS IDs must be converted to gene IDs or symbols for input into annotation enrichment tools. refTSS4 has newly launched a simple web tool for converting TSS IDs to gene symbols to support refTSS users.
1.1. TSS expression analysis and extraction of statistically significant TSSIDs.
- TSS sequencing is useful method for evaluation of gene expression value using TSS tags. refTSS4 introduces how to perform differential analysis of TSS on Tutorial of TSS differential analysis .
1.2. ID conversion from TSSID to Official Gene symbols.
- Conversion of differentially expressed TSSID to ID conversion tools
-
1.3. External enrichment tools (e.g., DAVID, Metascape, TopGO).
- The extracted Gene Symbols are input into external enrichment analysis tools such as DAVID, MetaScape.
1.4. Reference
2. GWAS-LD enrichment analysis on refTSS-LD
- As well as the other enrichment tools, refTSS provides simple enrichment analysis service, refTSS-LD. This service provides GWAS-LD enrichment analysis.
-
- From the menu, select refTSS-LD and paste the TSS IDs into the box.
-
- The table shows the results of the GWAS-LD analysis conducted using the example data. Results are sorted by order of FDR. The enriched TSS IDs are displayed in the "hits" column, allowing for inspection of which TSSs are concentrated in LD blocks grouped by traits.