Manual: Difference between revisions
m (Bolding and Italic words) |
(remove typo) |
||
| Line 8: | Line 8: | ||
</ul> | </ul> | ||
<body><h2 id='introduction'>Introduction</h2> | <body><h2 id='introduction'>Introduction</h2> | ||
<p>In this manual, we will introduce the functionalities of refTSS version 4 in a step-by-step manner, providing an overview of its features and how to utilize them effectively. In addition, we will introduce the <strong> | <p>In this manual, we will introduce the functionalities of refTSS version 4 in a step-by-step manner, providing an overview of its features and how to utilize them effectively. In addition, we will introduce the <strong>use-cases</strong>. We will showcase how to utilize the newly updated refTSS in research, particularly by providing examples of how to use the GWAS-LD enrichment analysis.</p> | ||
<hr /> | <hr /> | ||
<strong>Update information</strong> | <strong>Update information</strong> | ||
| Line 46: | Line 46: | ||
</ol> | </ol> | ||
</li> | </li> | ||
<li><p> | <li><p>Use-cases of refTSS version 4</p></li> | ||
</html> | </html> | ||
| Line 55: | Line 55: | ||
<ol start='' > | <ol start='' > | ||
<li>Surveillance of potential candidates for the promoter and proximal cis- | <li>Surveillance of potential candidates for the promoter and proximal cis-element of the gene of interest</li> | ||
<li>Investigating differences in expression levels between splicing variants using FANTOM5 TSS expression table</li> | <li>Investigating differences in expression levels between splicing variants using FANTOM5 TSS expression table</li> | ||
<li>Workflow of GWAS-LD enrichment analysis</li> | <li>Workflow of GWAS-LD enrichment analysis</li> | ||
| Line 131: | Line 131: | ||
<p style="text-align: center;"><img src="https://raw.githubusercontent.com/suimye/test_github/main/uPic/%E3%82%B9%E3%82%AF%E3%83%AA%E3%83%BC%E3%83%B3%E3%82%B7%E3%83%A7%E3%83%83%E3%83%88%202023-06-01%201.03.27.png" alt="スクリーンショット 2023-06-01 1.03.27" style="zoom:60%;" /></p> | <p style="text-align: center;"><img src="https://raw.githubusercontent.com/suimye/test_github/main/uPic/%E3%82%B9%E3%82%AF%E3%83%AA%E3%83%BC%E3%83%B3%E3%82%B7%E3%83%A7%E3%83%83%E3%83%88%202023-06-01%201.03.27.png" alt="スクリーンショット 2023-06-01 1.03.27" style="zoom:60%;" /></p> | ||
<ul> | <ul> | ||
<li>The gene and protein annotations are created based on information from GENCODE, ENTREZ gene, | <li>The gene and protein annotations are created based on information from GENCODE, ENTREZ gene, RefSeq, HGNC, MGI, and UniProt.</li> | ||
</ul> | </ul> | ||
Revision as of 03:57, 17 January 2024
Introduction
In this manual, we will introduce the functionalities of refTSS version 4 in a step-by-step manner, providing an overview of its features and how to utilize them effectively. In addition, we will introduce the use-cases. We will showcase how to utilize the newly updated refTSS in research, particularly by providing examples of how to use the GWAS-LD enrichment analysis.
Update information
- 2023.8.21: refine the manual texts.
- 2023.5.30: open refTSS Version 4 manual and use-case webpage.
- 2024.1.9: revised manual and use-case images.
Contents
Manual
New TSS ID and It's conversion tools
TSS search engine
Annotations
- Basic annotations
- cCRE annotation
- Gene and Protein annotation
- TATA-box annotation
- Displaying TSS expression table
Data source
Algorithm of GWAS-LD enrichment analysis
Data versions utilized in refTSS version 4
References
Use-cases of refTSS version 4
- Surveillance of potential candidates for the promoter and proximal cis-element of the gene of interest
- Investigating differences in expression levels between splicing variants using FANTOM5 TSS expression table
- Workflow of GWAS-LD enrichment analysis
Please visit Use-cases of refTSS version 4 for more information.
1. New TSS ID and it's conversion tool
- In version 4, we have discontinued the use of the old IDs (hg, mm) previously utilized in refTSS and introduced new IDs (rfhg, rfmm). The previous IDs posed maintenance challenges as they shared a similar ID system with the FANTOM5 project. The new IDs are completely independent, allowing for smoother updates and maintenance of the reference database.
- To assist users who were using the old IDs, we have developed an ID conversion tool, which enables easy conversion between the old and new ID formats. Additionally, we now offer a conversion tool that translates the new IDs to Gene Symbols. This utility is expected to enhance the usability of our data for standard annotation enrichment analyses.
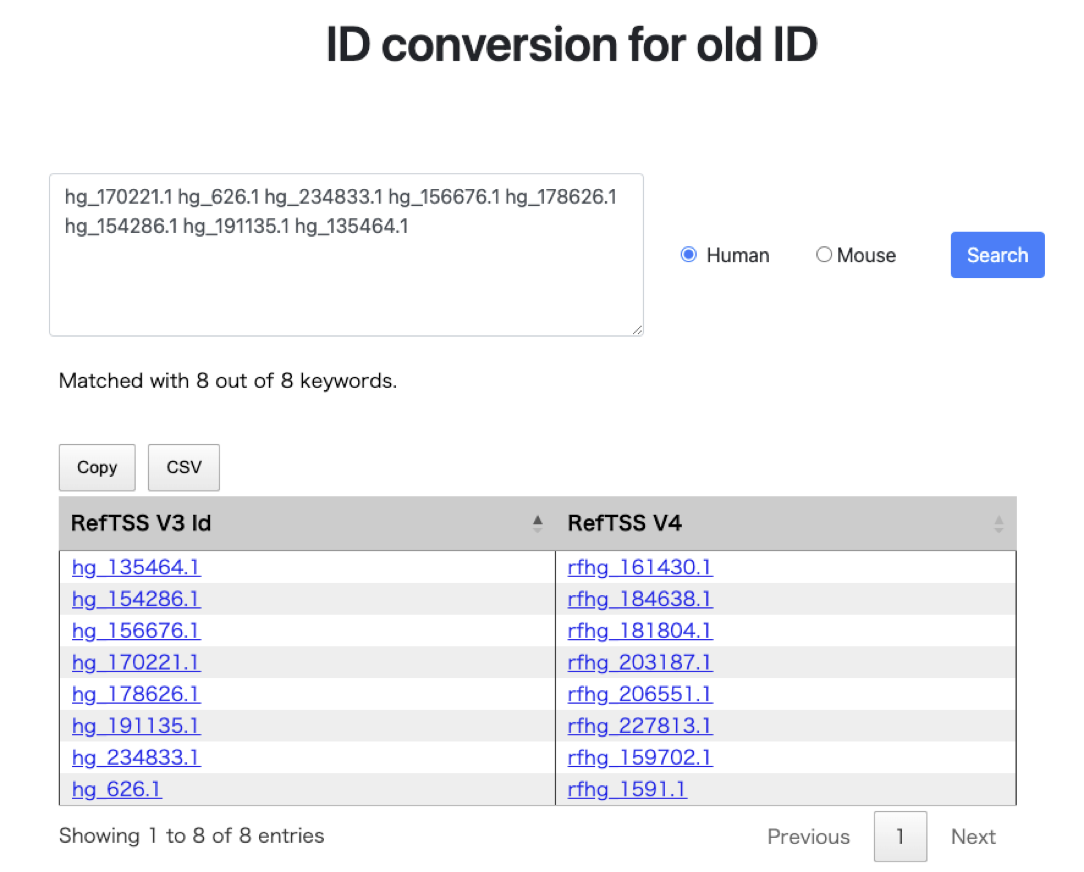
- The figure above illustrates an example where eight old refTSS IDs for human are entered, separated by spaces. Upon clicking the search button, a table is generated in the lower section. In refTSS version 4, out of the IDs present in version 3, a total of 1,778 IDs have been discontinued through the quality evaluation process. For such deprecated IDs, refTSS version 4 displays
Not available (NA)to indicate their unavailability. This result can be conveniently copied to the clipboard or exported as a CSV file, allowing for easy data extraction and analysis. - The above interface allows for the conversion of refTSS4 IDs into Gene Symbols, which facilitates various annotation analyses. For guidance on how to use this feature, refer to the example workflow on the Use-cases page.
2. TSS search engine
- The main functionality of refTSS, which is the TSS information search engine, is implemented on the homepage. Users can explore the TSS annotations in both mouse and human genomes using TSS ID, Gene ID, or Gene Symbol as search parameters. The human genome version used is hg38, while the mouse genome version is mm39.
- In the example, let's consider the result when entering an empty TSS ID ("rfhg_19704.1") as the search parameter.
The figure above illustrates an example where ATF3 refTSS IDs (
rfhg_19704.1) for human are entered. In this result, along with the current TSS ID and the old version (3) ID, the gene name, genomic coordinates, and candidate cis-element information (cCRE) are displayed. PLS stands for Promoter Like Signature, indicating that the TSS (rfhg_19704.1) is located near the promoter region. This information provided by ENCODE SCREEN database. Here is the list of abbreviation. More details were described in SCREEN website.- PLS: promoter like signature supported by the subset of representative DNase hypersensitivity sites (rDHSs) with histone modifications (H3K4me3 and H3K27ac) and CTCF-binding.
- ELS: enhancer like signature supported by the subset of representative DNase hypersensitivity sites (rDHSs) with histone modifications (H3K4me3 and H3K27ac).
- CTCF only: DHS and CTCF binding signatures.
- PPLS, PELS: proximal signatures within the 2 kb of a TSS of mRNA.
- DPLS, DELS: remaining subset of the other signatures located on intergenic regions.
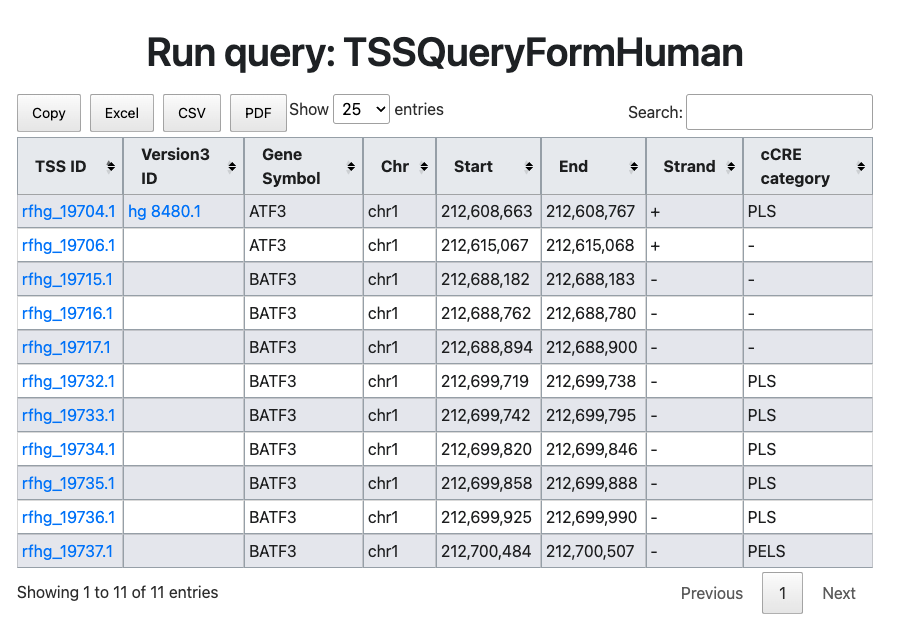
- Furthermore, when searching by gene name, all annotated TSSs associated with that gene are listed (It is important to note that searching by gene name may take some time to display the results as multiple TSSs related to the gene may appear).
3. Annotation
3.1. Basic annotation
- In the Basic annotation section, the correspondence between the newly introduced TSS IDs and the IDs from the previous version is provided, along with the number of datasets detected by the TSS cluster calling (up to 16 for human). If there are multiple IDs from the previous version, it indicates that they have been merged into the respective TSS in the new version.
3.2. cCRE annotation

- The CCRE annotation is based on information from the ENCODE SCREEN database, which was introduced in the search engine section. By clicking on the ID, you can follow the link to the SCREEN website and explore the details of the cis-elements.
3.3. Gene and Protein annotation
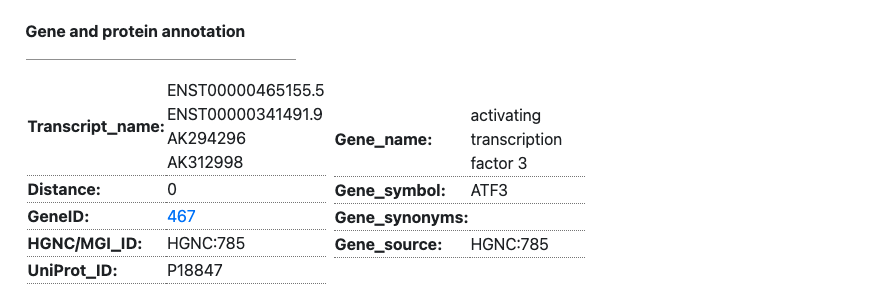
- The gene and protein annotations are created based on information from GENCODE, ENTREZ gene, RefSeq, HGNC, MGI, and UniProt.
3-4. TATA box annotation
- This figure will revise.
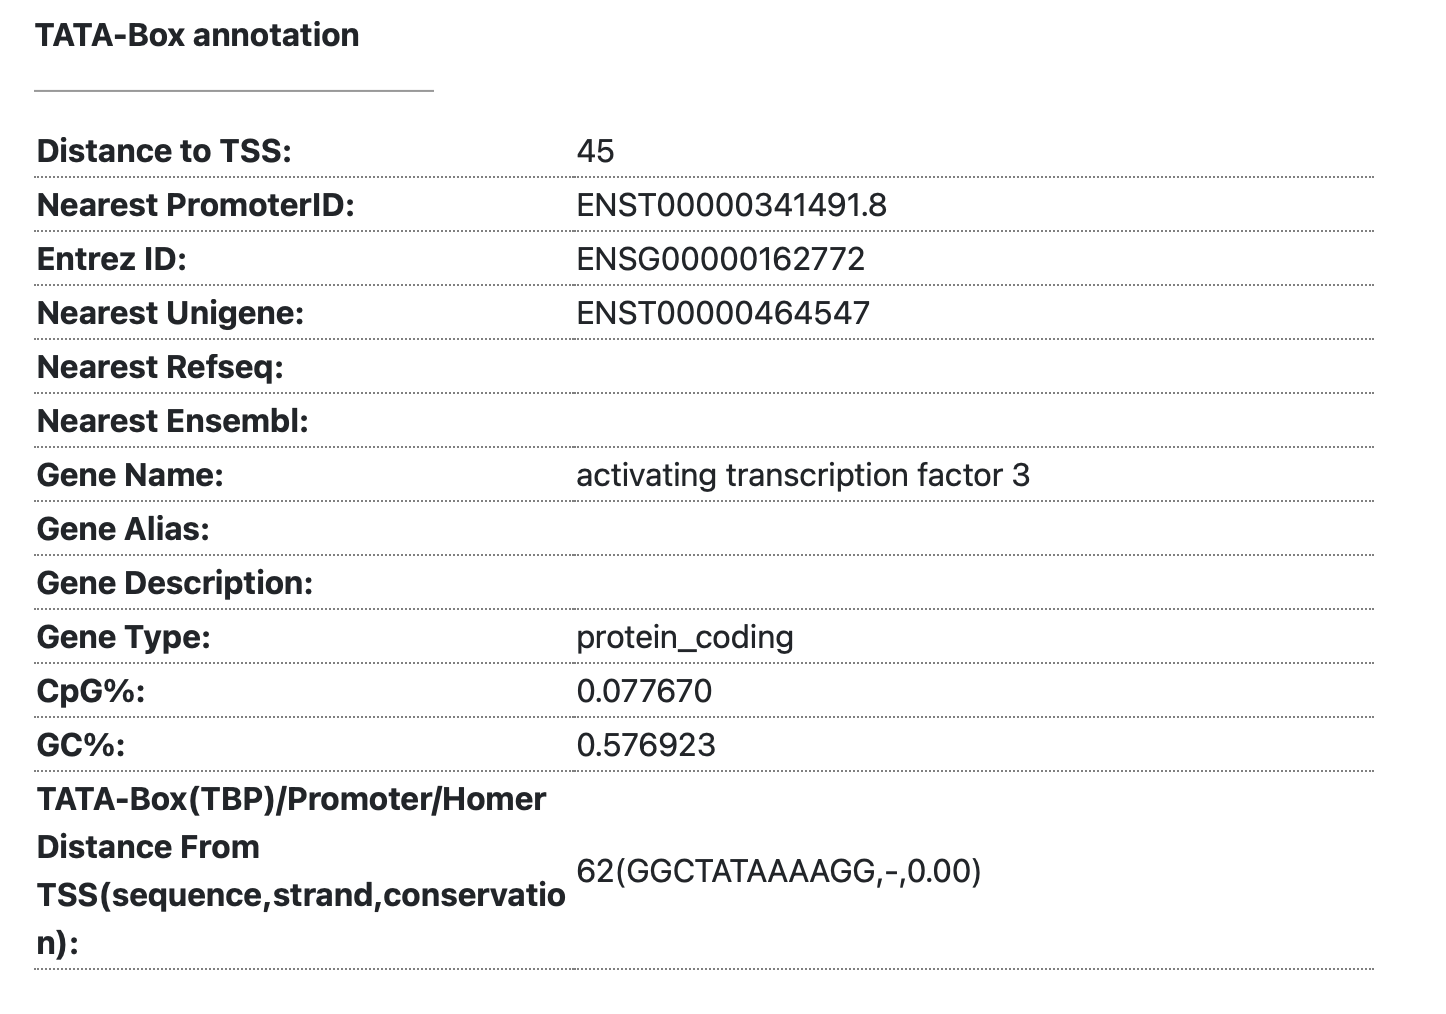
- The TATA-box motif is a signature detected approximately 25-30 base pairs upstream of the mRNA transcription start site. It is a classical DNA motif recognized by the TATA-box binding protein (TBP). This information displays the distance from the TSS to the TATA-box, allowing you to determine whether it is a TATA-dependent promoter. Additionally, you can investigate characteristics of the promoter such as its GC content.
3-5. Displaying expression Profile
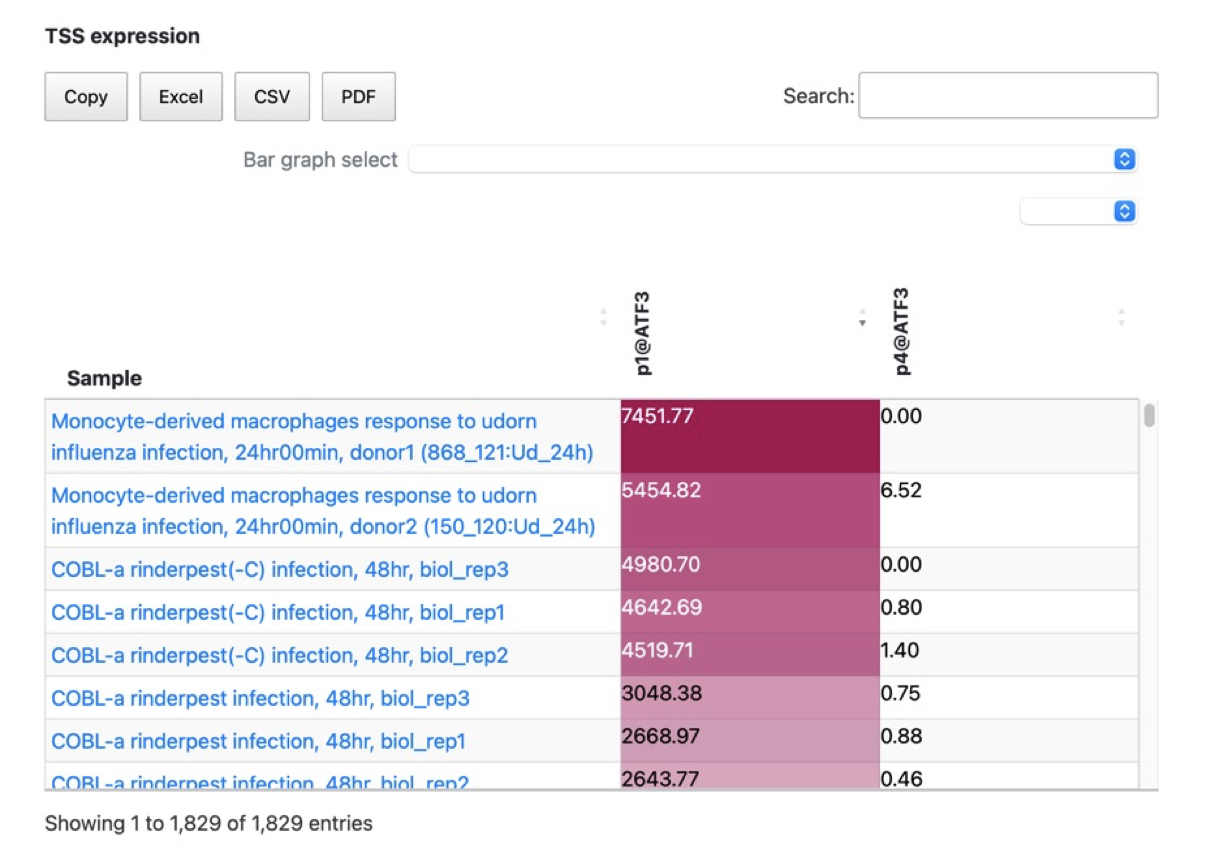
- In refTSS4, we have connected the new TSS IDs with the promoter expression from FANTOM5. The table displays standard TPM values and allows for comparison, copying to the clipboard, and downloading of the promoter expression data from FANTOM5 in EXCEL, CSV or PDF format. This expression data is extracted from the FANTOM promoter associated with the genes linked to the TSS in refTSS4. As a result, when querying with a TSS ID or clicking on a TSS ID, the annotation information for that TSS is displayed in the lower section along with the corresponding FANTOM promoter expression. The expression data is visualized using a red gradient, where higher expression levels are represented by darker shades of red. By clicking on the column headers of the FANTOM promoter data, you can sort and display the data based on the expression levels.
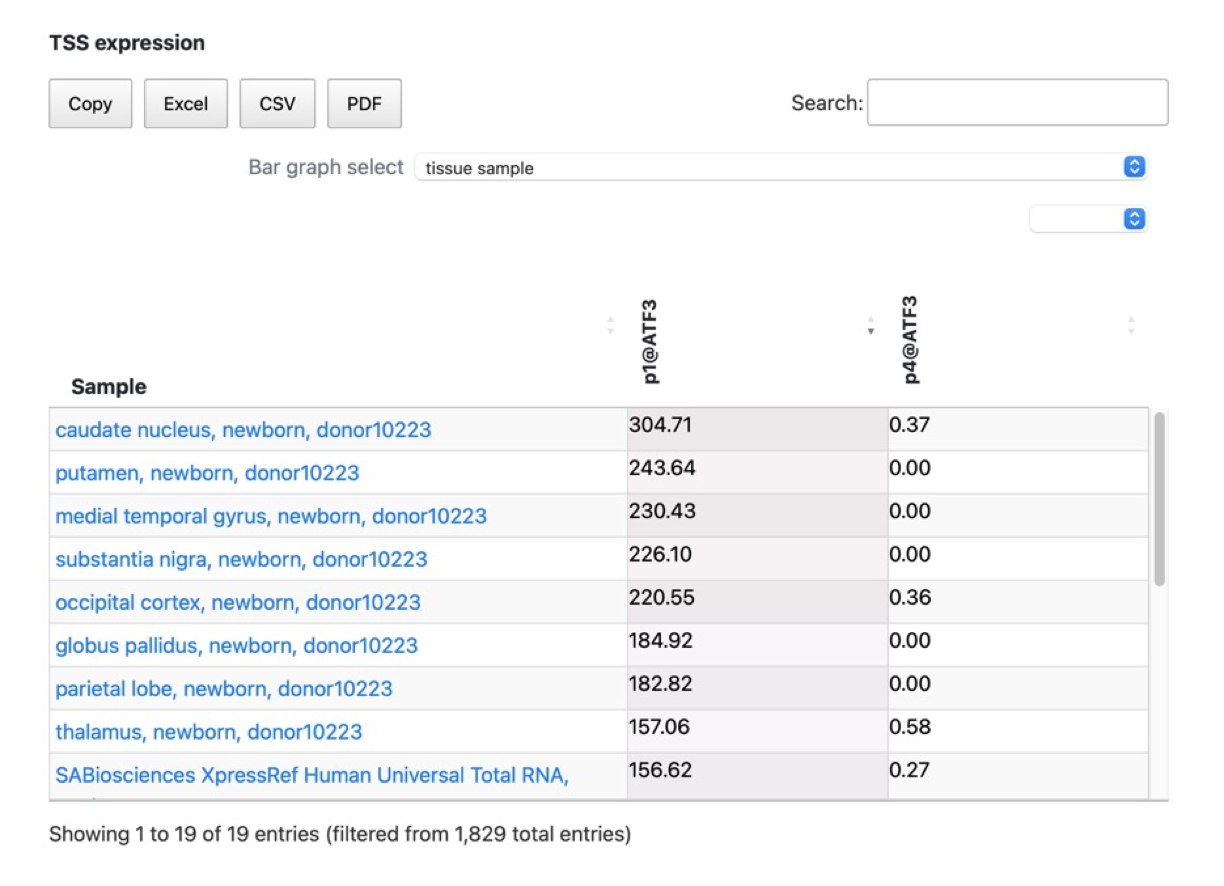
- Additionally, we have provided a feature that allows you to extract and display specific types of samples using the ontology information from FANTOM. As shown in the figure above, you can selectively display samples such as tissue-specific samples by making the appropriate selections.
4. Data source
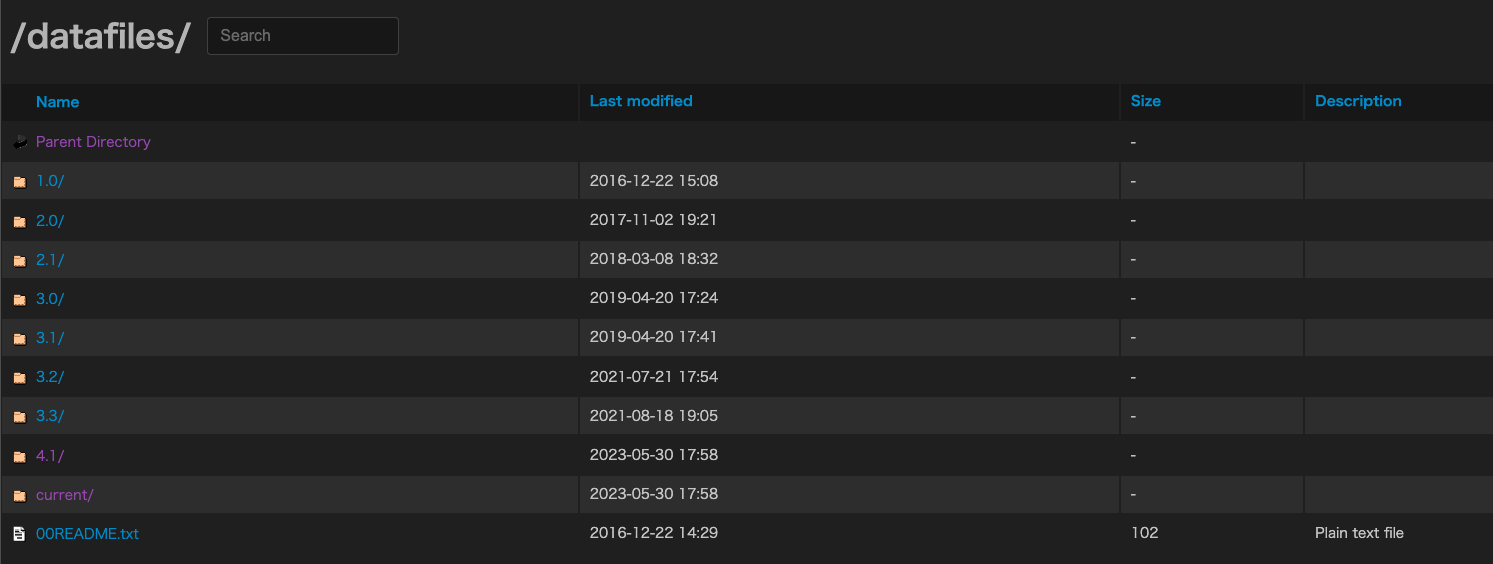
- The refTSS files are available in separate folders for each version. Detailed information about each dataset can be found in the README file.
5. GWAS-LD enrichment analysis
- GWAS-LD enrichment analysis is a statistical analysis method implemented for the first time in refTSS4, specifically for human TSS data. This method examines the number of TSSs overlapping with LD blocks on the genome for a given TSSID list provided by the user (e.g. significant TSS sets from differentially expression analysis). It then assesses whether the observed number of overlapping TSSs is significantly higher than the expected frequency by chance, indicating enrichment in LD blocks (i.e., a higher concentration of TSSs in a specific LD block category). In this method, we use trait information from the GWAS of SNPs associated with LD blocks to group these LD blocks using these traits as labels. This then performed hypergeometric test for each of these GWAS-LD groups (note: group label is trait).
- Here is the table of the number of TSS IDs.
| Query TSS (User provided TSS ID) | Entire TSS IDs | |
|---|---|---|
| Trait A (a GWAS-LD group) | x | m |
| the other IDs | k-x | n |
| Total number of TSS | k | m + n |
x: the number of query TSS IDs assigned in Trait A.
n: the number of TSSs which were not assigned in Trait A.
m: the number of Trait A assigned TSS IDs in entire TSS ID.
k: the number of query TSS IDs.
The hypergeometric distribution is used for sampling without replacement process. The density of this distribution with parameters
m,nandkis given by

for x=0,…,k.
Note that p(x) is non-zero only for max(0,k−n) ≤ x ≤ min(k,m).
- This LD information is based on all human populations (ALL) including phasing data from the Human 1,000 Genomes Project phase 2. We utilize locally reconstructed NCBI's LDLink database for extracting highly linked genome regions (r^2 > 0.8)
- The table shows the results of the GWAS-LD analysis. The enriched TSS IDs are displayed in the "hits" column, allowing for inspection of which TSSs are concentrated in LD blocks grouped by traits. GWAS_trait: The name of human trait associated with TSS enriched LD blocks. FDR: False discovery rate (a.k.a. Benjamini & Hochberg) calculated from multiple correction of given P-value. tss_set: the number of LD blocks in the genome. overlap: the number of assigned TSS IDs in this trait. background: the number of entire TSSs in the genome (universe size). hits: the enriched TSS IDs are linked to their annotations.
Result table of GWAS-LD enrichment analysis
6. Data versions utilized in refTSS version 4
1. Basic Annotations
- We provide information about the version details of the database we used, as recorded in a specific file that outlines this information.
| Database | Version |
|---|---|
| GENCODE | human: release 38, mouse: M27 |
| NCBI ENTREZ GENE | September 3, 2021 |
| Uniplot | release 2015_03 |
2. CCRE annotation
| Database | Version |
|---|---|
| ENCODE SCREEN | Registry V3 |
3. GWAS-LD enrichment analysis
| Database | Version |
|---|---|
| LDLink | 5.1 |
| GWAS catalog | v1.0.2 |
7. References
- Abugessaisa I et al., refTSS: A Reference Data Set for Human and Mouse Transcription Start Sites. PMID: 31075273 DOI: 10.1016/j.jmb.2019.04.045
- Alistar RR Forrest et al., A promoter-level mammalian expression atlas. PMCID: PMC4529748 DOI: 10.1038/nature13182
- ENCODE Project Consortium, Jill E. Moore et al. 2020. Expanded Encyclopaedias of DNA Elements in the Human and Mouse Genomes. PMID: 35474001 doi: 10.1038/s41586-021-04226-3.
- Buniello A. et al., The NHGRI-EBI GWAS Catalog of published genome-wide association studies, targeted arrays and summary statistics 2019. PMCID: PMC6323933 DOI: 10.1093/nar/gky1120.
- Machiela M. et al., LDlink: a web-based application for exploring population-specific haplotype structure and linking correlated alleles of possible functional variants. PMCID: PMC4626747 DOI: 10.1093/bioinformatics/btv402.
- Benjamini, Y., and Hochberg, Y. (1995). Controlling the false discovery rate: a practical and powerful approach to multiple testing. Journal of the Royal Statistical Society Series B, 57, 289--300. http://www.jstor.org/stable/2346101.